
Natural language generation (NLG), the process of generating text or narratives based on a set of data values, can reach a broader audience. NLG narratives can be used for a variety of purposes, but in this perspective I focus on how NLG can be used to enhance business intelligence (BI) processes. In the case of BI, NLG can be used to explain what has happened and why it is happening, and even what actions to take. The NLG narratives can be understood by a broader range of business users than the tables and charts of data that are the typical output of most BI applications or analytics tools.
Research suggests that BI is not being used to its full potential. My colleague Mark Smith recently wrote about some of these issues, highlighting NLG and notifications as ways to improve the delivery of information and analytics to end users.
Today, data is delivered to most BI users in the form of tables with rows and columns or a variety of graphical representations. Nearly all BI vendors have invested heavily in data-visualization capabilities, offering an ever-increasing number of graphs so that users can quickly and easily change the data selection and how it is presented. The intention of these visualization capabilities is to enable users to “see” interesting relationships in the data.
These advances have certainly been helpful. We can visualize more data in more ways and on more devices than ever before. But these techniques are helpful only to the subset of users who can interpret what they are seeing and understand what actions they should take as a result. For many people a table of numbers or a chart does not indicate as clearly as text how a person should react to the information. Consider this example:
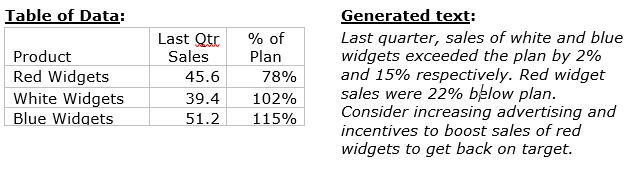
In our Information Optimization Benchmark Research, participants confirmed the value of 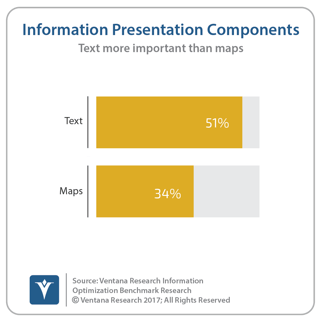 text–based presentation; half described it as a critical presentation component, citing it more often than maps. Yet most BI products supported maps long before they began to support text-based presentation techniques.
The tide is changing. Several vendors have jumped on the opportunity to augment BI with NLG, including Automated Insights, Narrative Science and Yseop. Each offers a product that can generate text or what is called narratives based on a set of data values generated from analytics. Many analytics and BI vendors have established partnerships with one or more of these vendors to support embedding their generated text into reports and dashboards. Some vendors have chosen to develop their own text generation capabilities in addition to or instead of partnering. As a result, users of a wide variety of BI tools, including Microsoft Excel, can now generate text to explain what the data means.
Machine learning is another technology that can be used to help end users understand data and take action. As I have written, machine learning is growing in popularity. These machine learning algorithms can be used to identify trends in the data and recommend actions based on those trends. Some processes can even be automated using these techniques.
Machine learning plays a role in NLG also. The rules for generating text are often driven by machine-learning algorithms; they make NLG easier to set up and the resulting text more natural. NLG can also complement machine learning by generating text that explains the algorithms or findings so users can better understand why certain actions are being recommended. For example, a machine learning algorithm might score the likelihood of a customer, John Smith, purchasing product A at 87 percent. The narrative generated could say, “John Smith shares many characteristics, including age, gender and prior purchases, with other customers who have purchased product A, indicating an 87 percent likelihood that he would purchase this product.”
NLG is not a panacea, but it can be used to broaden both the reach of business intelligence and its effectiveness. If your organization has not deployed NLG capabilities yet, you should consider them in conjunction with your analytics and BI deployments.
Regards,
David Menninger
SVP & Research Director
Authors:

David Menninger
Executive Director, Technology Research
David Menninger leads technology software research and advisory for Ventana Research, now part of ISG. Building on over three decades of enterprise software leadership experience, he guides the team responsible for a wide range of technology-focused data and analytics topics, including AI for IT and AI-infused software.