
We are happy to share some insights about Tableau drawn from our latest Value Index research, which assesses how well vendors’ offerings meet buyers’ requirements.
-1.png?width=400&name=VR_VI_Analytics_and_Data_Logo%20(3)-1.png) Earlier this year we published the Ventana Research Value Index: Analytics and Data 2021, the distillation of a year of market and product research efforts. We then developed three additional Value Indexes on analytics and business intelligence focusing on mobile, embedded and collaborative capabilities. Because each is a critical aspect of modern BI, we developed specific criteria to provide an in-depth look at features geared specifically to mobile, embedded and collaborative use.
Earlier this year we published the Ventana Research Value Index: Analytics and Data 2021, the distillation of a year of market and product research efforts. We then developed three additional Value Indexes on analytics and business intelligence focusing on mobile, embedded and collaborative capabilities. Because each is a critical aspect of modern BI, we developed specific criteria to provide an in-depth look at features geared specifically to mobile, embedded and collaborative use.
In all of our Value Indexes, we utilize a structured research methodology that includes evaluation categories designed to reflect real-world criteria incorporated in a request for proposal and vendor selection process for analytics and business intelligence. We evaluated Tableau and 17 other vendors in seven categories: five relevant to the product and experience – Adaptability, Capability, Manageability, Reliability and Usability – and two related to the customer experience – Total Cost of Ownership/Return on Investment and Vendor Validation. To arrive at the Value Index rating for a given vendor, we weighted each category to reflect its relative importance in an RFP process, with the weightings based on our experience and on data derived from our Benchmark Research on Analytics and Business Intelligence. Tableau had an overall performance rating of 67.1% in the Value Index, with a 71.5% customer experience rating and a 66.3% product experience rating.
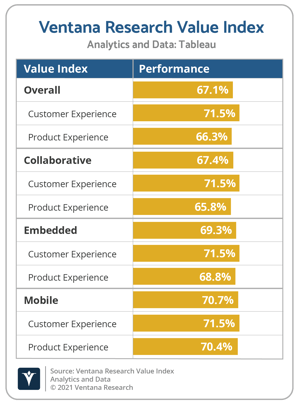 Tableau was an independent, publicly traded vendor of BI software until it was acquired by Salesforce in 2019. It was categorized as a Vendor with Assurance, ranking 11th overall in this Value Index evaluation. Tableau was a Value Index Leader in Reliability and also performed best in Validation.
The Tableau product is available as an on-premises and — increasingly — as a cloud-based offering. Tableau has pioneered intuitive ways to interact with and visualize data. And it continues to innovate in this area. Data can be extracted from its sources into Tableau’s in-memory architecture or it can be accessed in place with a “live connection.” The company has recently added data preparation capabilities to the product line, and also provides natural language processing capabilities called “Ask Data” and “Explain Data.”
Tableau would perform better in Adaptability with stronger business process and application integration. More collaboration and predictive analytics capabilities would help improve its Capability rating. As the natural language processing of Ask Data matures it will also help improve Tableau’s Usability rating.
Collaborative tools can enable a diverse group of participants to coordinate their activities and share knowledge. We expect that by 2024, three-quarters of BI software platforms will include collaborative capabilities designed to support organizations’ decision-making, task management and compliance requirements associated with analytics. The Tableau product supports emailing and sharing analyses, posting analyses to third-party collaboration tools via URLs, annotations, and comments on analyses and alerting. Its Capability ranking would improve with notifications, discussion groups, wall posting, social recognition for contributions, and assigning and tracking tasks to completion.
Organizations recognize the importance of embedded analytics to make analyses easier to perform and more accessible to line-of-business personnel. Nearly three-quarters of participants in our Data and Analytics in the Cloud Benchmark Research said they considered embedded analytics important. Tableau offers developers JavaScript application programming interfaces, REST APIs and a metadata API. It also provides a toolkit for using C, C++, Java or Python to create and publish data extracts. Most elements of the visualization are customizable, allowing for rebranding of many — but not all —components. Additional visualizations, more data manipulation functions (financial, spatial, user-defined) and better support for documents and text would help improve its Capability score.
Line-of-business personnel need access to mobile analytics in the normal course of conducting business. Mobile devices also offer capabilities such as voice interaction, location information and cameras that can enhance the user experience. While differing in the approach to designing these applications, vendors are focused on providing access to analytics that support a mobile workforce. Tableau Mobile is available as a native application for iOS and Android devices. It provides good navigation, interaction and search capabilities and supports both connected and disconnected modes. The mobile product integrates well with other content developed for Tableau, and it supports a highly personalized view of data. Additional visualizations, better collaboration and support for wearables would help improve its Capability score.
This assessment was based on Tableau’s analytics products available in December of 2020. Since then, Tableau has released 2021.1, which includes a number of enhancements and new features. Einstein Discovery’s augmented analytics capabilities, originally developed by Salesforce, are now available in several ways within Tableau. The Einstein dashboard extension allows individuals to click on one or more rows of data from a visualization to get dynamic predictions and see key drivers of predictions. Einstein predictions can also be incorporated into Tableau calculated fields and can be used for bulk scoring via Prep Builder. There are also enhancements to Ask Data, Tableau’s natural language query capability. This release includes a redesigned notification center and automated data quality warnings. You can see the full list of enhancements here.
Organizations should evaluate data and analytics requirements including collaborative, embedded and mobile capabilities to ensure existing solutions are meeting the organization’s needs. If existing solutions are not satisfying those requirements, organizations should consider whether Tableau can help meet those needs.
This research-based index is the most comprehensive assessment of the value of analytics and BI software in the industry. Technology buyers can learn more about how to use our Value Index by clicking here, and included vendors that wish to learn more can click here. Read the report here.
Regards,
David Menninger
Authors:

David Menninger
Executive Director, Technology Research
David Menninger leads technology software research and advisory for Ventana Research, now part of ISG. Building on over three decades of enterprise software leadership experience, he guides the team responsible for a wide range of technology-focused data and analytics topics, including AI for IT and AI-infused software.